Chris Froome is currently regarded as the best climber/stage racer and heads into the Tour de France as the overwhelming favourite. In 2013 we are yet to see a climber equal Froome in head-to-head racing. The question, then, is – based on Froome’s past performances, what performance can we expect at the Tour and what would it take to beat him?
In evaluating Froome we must wind the clock back to August of 2011 and his breakthrough performance at the Vuelta. On a 20% section of the famous Angliru with 2km to go, Froome was released from his domestique duties, but it was too little too late. Since that day, though, we’ve witnessed twelve climbs where Froome has performed at a very high level.
Using the pVAM approach, there are two ways in which we can analyse Froome’s performances. Firstly, we can compare Froome’s efforts against the historical baseline which we have already established (updated with Giro 2013 results that overall lowered the baseline). Secondly, we can estimate an equation which will explain Froome’s VAM in terms of gradient, altitude, and climb length.
Method One: Froome v Historical GT Baseline 2008-2013
The latest equation for estimating pVAM is:
pVAM = 2885.17 + 416.825 ln(Gradient) – 0.0620 Vclimb – 0.0880 Altitude
Compared with the equation before the Giro:
pVAM = 2912.14 + 426.293 ln(gradient) – 0.0711 Vclimb – 0.0836 Altitude
After lacklustre performances in the Giro the changes to the constant and altitude coefficient have shifted in the direction of slower pVAMs. However, the gradient factor has reduced, which in most cases will offset the decrease in the constant, and the Vclimb is now subtracting less from pVAM. Before and after examples are listed in the table below, and the change is minor (the pre-Giro equation is 0.1% faster on average).
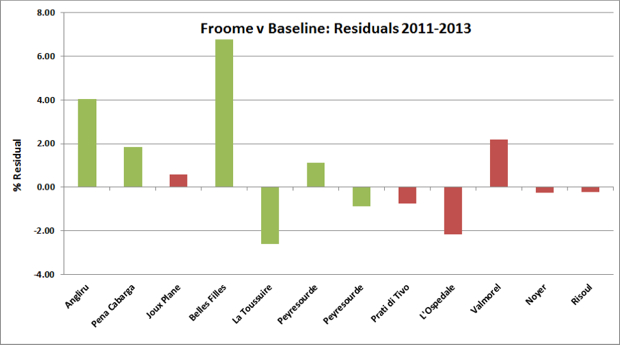
The average residual for Froome for the twelve climbs mentioned above is 0.805%. On average he performs close to one per cent better than the historical baseline predicts. One important observation is that overall, performances on GT climbs (green) are better than those on climbs in shorter stage races (red).[ref]Some caution is required due to the small sample size dominated by two positive outliers.[/ref]
Such a result is unsurprising given that riders will only want to hit their best form in the three-week events. Additionally, Froome may only push himself to his absolute limit when the big occasion calls for it (although we should note that he held himself back for Wiggins last year). So far this season Froome has out-climbed his rivals comfortably, giving the appearance that on those days he left some gas in the tank. The counterpoint, however, is that during the weeklong stage races there should be less accumulated fatigue.
We can use Froome’s average residual to transform baseline pVAMs into “Froome-pVAMs” simply by multiplying pVAM by 1.0805. In this way FpVAM gives us the VAMs predicted specifically for Froome for the upcoming Tour de France.
Predicted VAMs for the 2013 Tour de France:
| Gradient | Vclimb | Altitude | pVAM(pre-Giro) | pVAM(post-Giro) | FpVAM | |
| Bonascre | 0.0746 | 664 | 1372 | 1644 | 1641 | 1655 |
| Ancizan | 0.0765 | 780 | 1589 | 1628 | 1626 | 1639 |
| Ventoux | 0.0878 | 1370 | 1911 | 1618 | 1618 | 1631 |
| Alpe d’Huez | 0.0811 | 1119 | 1850 | 1607 | 1606 | 1619 |
| Croix Fry | 0.0705 | 821 | 1479 | 1600 | 1599 | 1612 |
| Semnoz | 0.0858 | 914 | 1648 | 1663 | 1660 | 1673 |
Method Two: Froome Regression Analysis
Alternatively, taking Froome’s previous performances, we can run a regression to define an equation which fits his performances alone: [ref]In this case, the length of the climb (Vclimb) is not a statistically significant determinant of VAM. This result is not unusual for the small sample size; it may also indicate some inconsistencies between performances. Overall, the model still fits well.[/ref]
pVAM = 3412.06 + 604.343 ln(Gradient) – 0.0855 Vclimb – 0.0971 Altitude
Applying this equation to the climbing statistics above, we can produce Froome-specific pVAMs.
| Method One | Method Two | |
| Bonascre | 1655 | 1653 |
| Ancizan | 1639 | 1638 |
| Ventoux | 1631 | 1639 |
| Alpe d’Huez | 1619 | 1619 |
| Croix Fry | 1612 | 1595 |
| Semnoz | 1673 | 1690 |
These results are quite remarkable in that there is little difference between the approaches. Indeed, they both predict exactly the same VAM for Alpe d’Huez. Quite surprising is that a VAM of 1619 on Alpe d’Huez corresponds to a time of 2488 seconds, or 41’28”.[ref]Time (s) = (Vclimb/VAM)*3600[/ref]
In historical terms this time is quite slow for a Tour de France favourite, although similar to the ascents of Sanchez (41’24”) and Contador (41’33”) in 2011. Contador’s performance came after two hours of maximum effort and at the end of an attempted Giro-Tour double. If Contador can reach his 2011 form, can he match or even beat Froome? The data suggests yes, possibly.
Remember that a pVAM is only what is expected from an average performance of a top-3 rider over a three-week tour. Given the importance of Alpe d’Huez to this year’s race, it means we would expect an above-average performance. Froome’s entire season is geared towards the final week of the Tour – if he has another level, this is where we will see it.
How fast can Froome go? Breaking the 40-minute barrier requires a VAM of 1679, or 4.5% greater than (baseline) pVAM. Historically, such a level is not unattainable, but in a presumably cleaner era it would require several factors being very favourable. Firstly, Froome has to find top form. For a chance of a sub-40’ time we will need to see a reasonable positive residual (all things being equal) on an earlier climb in the Tour. Secondly, the conditions need to be favourable – no rain, no extreme temperatures, no headwind. Thirdly, Sky (or another team) needs to set a strong pace from the bottom of the climb; it is rare to see strong positive residuals without a big leadout. Finally, the most important factor is competition. It’s highly unlikely that we will see a maximal effort from Froome if the general classification is already decided or there are no climbers to lay down a challenge. I believe that a high 39 minute time is possible if these factors align, however, if only one or two are favourable we may see a time around 41 minutes, or 1-2.5% greater than pVAM. Given the importance of the stage/race, I would be surprised to see a winning time significantly slower than the 41 minutes 28 seconds predicted for Froome.
Alpe d’Huez is not the only climb of historical value in this year’s race. Bonascre (Ax-3-Domaines) and Ventoux are both used regularly in the Tour. The predicted VAM for Froome is very similar to the performance of Contador and Schleck in 2010. It should be noted that Contador and Schleck were performing track stands marking one another, with Menchov and Sanchez 14 seconds quicker on the day. The same climb has been used in 2001, 2003, and 2005, and the time we predict for 2013 would be close to a top 5 in those years (although in 2005 the race had already exploded on the previous climb). For Ventoux, the predicted time is around 50’17” which is more than a minute slower than Contador and Schleck in 2009. The remaining three climbs are all being used in a finishing position at the Tour for the first time, so there is no historical reference point available.
As the predicted performances of Froome on the above climbs are not remarkable by historical standards, there is room for the other general classification contenders to find an extra gear for this year’s race. Froome too will need to lift it a notch if he wants to continue his domination; otherwise the battle in the mountains may be closer than has previously been anticipated.






No Comments