fer the advanced kids raggin on the entry level explanation of the ABP software
for the deeper understandin check WADA operating guidelines
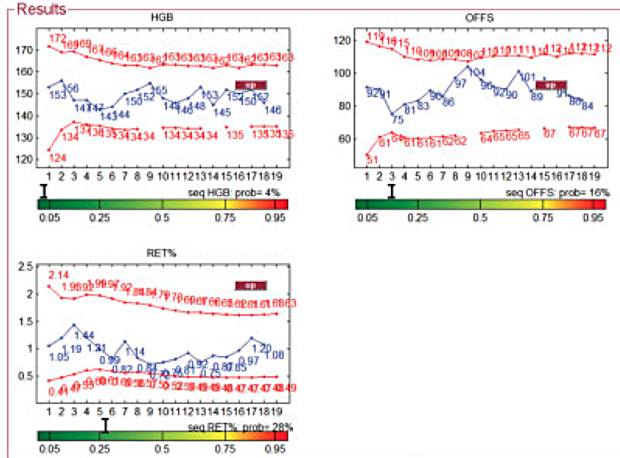
then consider this figure
with actual ABP software output:
so
at the basic level
the blood values
are inputted into the software
and 2 things happen
1. the software uses the info
to adapt the thresholds
(the 99.9 confidence limmit)
in an effort to tighten the thresholds
based on the athletes physiology
2. the software the plots the new blood data
and flags values that fall outside the thresholds
the intent is that the software screens for abnormal profiles and flags them so that the profile can go on to expert review.
…
the calculation of thresholds
is called an adaptive model
because while it starts with population norms
(see how the high and low red threshold lines start very wide)
as additional data becomes available
the model automatically adapts
(note how the gap between the high and low narrows)
the method originally proposed
was based on Bayesian inferences
which would open the possibility
to add multiple factors that further improve
the predicted confidence limmits
for example
the population based threshold
ranges from 12 to 17
but
once a rider has a hgb measured
at
13
it becomes much less likely
that their natural value
would ever reach 17
therefore
the upper limmit can be lowered
(at some point it the bayesian approach was not fully implemented or watered down somehow but the details are not entirely clear from the operating guidelines)
ironically as can be seen in the outputs above
slow changes
such as might be seen with long term micro dosing
has the effect of shifting the riders thresholds
to adapt to their doped physiology
while tapering the dope
would have the opposite effect
ie
dope fast or come off fast
get popped
otherwise it’s steady as she goes
…
now
with regards to armstrongs data
this author don’t have the software
and as such
can’t exactly run armstrongs data through it
and
inserting this discussion
into
that post
would have lost the attention
of anybody with a life
so
compromises were made
in simplifying the adaptive thresholds
down to a best fit aproach of static values
so that the
concept
(that the software flags extreme high and low values
not patterns of elevated or suppressed values)
could be illustrated
to
a much broader audience
veloclinic is the reincarnation of one of our favorite Twitter friends, @captaintbag1, whose tumblr blog posts were a kind of blank verse, Tecate-soaked haiku of truthiness that cut through the slick bullshit and to the very core of what is gloriously fucked up about the sport of cycling. Although the Cap may be gone (sort of), his Doctor tbag/Captain Hyde alter ego lives on, and we’re glad to share his pithy analysis here. Lest you think these are the idiot ramblings of a madman, we’d like you to know that the doc is a legitimate professional in the science of sports medicine, and a savant when it comes to doping analysis. You have been warned.


1 Comment
For those interested, the APMU is described correctly by veloclinic as I understand it by reading the WADA standards. However, the APMU is run by humans who are routing suspicious tests. Ashenden makes it clear that athletes have been caught with “too normal” values like Armstrong’s.
Based on scant information provided over time, it seems Saugy’s lab was providing the APMU service. IMHO, the samples were never passed. Someone, somewhere knew better than to pass Armstrong’s probably suspicious results.
The UCI was picking winners. How exactly? Not sure. The test suppression explains Sky’s **extraordinary** 2012.