Editor’s note: this narrative by doc has a video explainer here. Think of them as companion pieces to introduce and de-mystify the concept of measuring climbing performances objectively.
* * *
quick disclosure things have gotten a bit obsessive lately
one of docs goals is to create an assumptionless model
like Scott Richards pVAM
but that can bridge to the W/kg estimates
and physiology based DpW/kg
(in a perfect world can’t have it all right?)
the ideal would be
to use the structure of w/kg estimates expressed in directly measurable terms
performance = (a) VAM + (b) V^3 + (a)(c) V
combined with the critical power model
performance = (d) 1/vClimb + (e) altitude
to get
(a) VAM + (b) V^3 + (a)(c) V = (d) 1/vClimb + (e) altitude
problem is that’s a whole lotta coeffiicients
(although some help might be on the way)
in the meantime
another way of looking at things
is that the relative contributions of
(a) VAM + (b) V^3 + (a)(c) V
to the total power
is gradient dependent
gradient = (a) VAM + (b) V^3 + (a)(c) V
so normalizing any of those for gradient
would not give total power
but tell us how total power is changing by change in component per gradient
turns out the relationship between VAM and Gradient
is not straight forward
(its not easy to manipulate one to straighten the curve)
on the other hand
the relationship between
V and gradient
actually
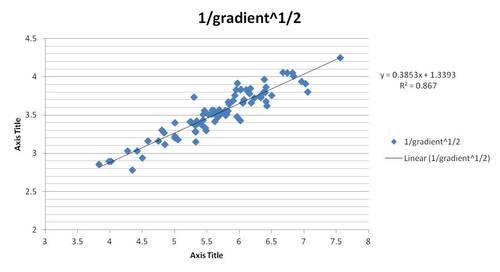
V = 1/gradient^1/2
is linear
so a simple transformation gives the new performance variable
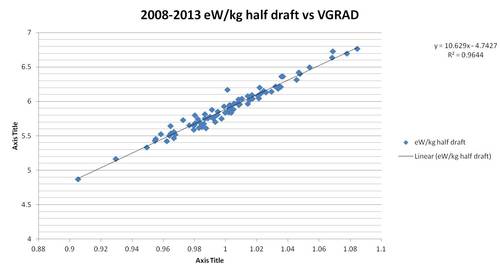
VGRAD
which does a helluva a job looking like
W/kg
(note that the fudge factor reduces the variability in the data but that is fixed later)
with something that looks this promising
it makes sense to use the CP model structure
VGRAD = 1/vClimb + Altidude
run the OLS
and
viola (pronounced vee oh lah)
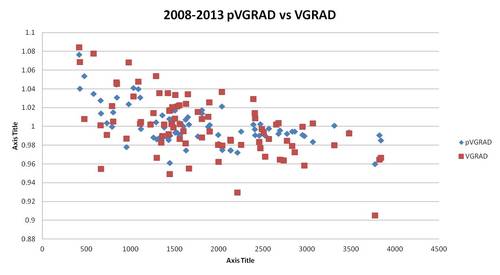
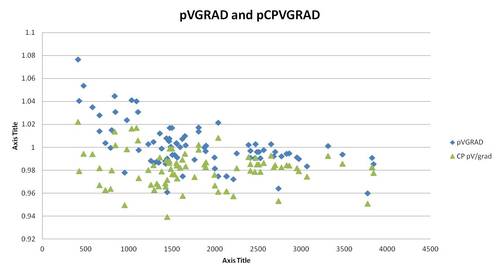
pVGRAD
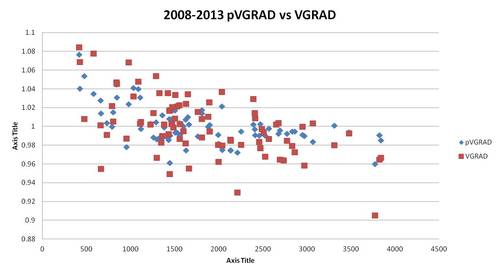
an assumption less prediction tool
that should satisfy most of the critics of assumptions
as well as
having the “right” Critical Power model shape
ramping for the short climbs allowing analysis of the Vuelta climbs
and having the Critical Power model structure
(note the green is the CP component and the difference between the green and the blue is the reserve component)
for future integration with the Blood Dope Simulator
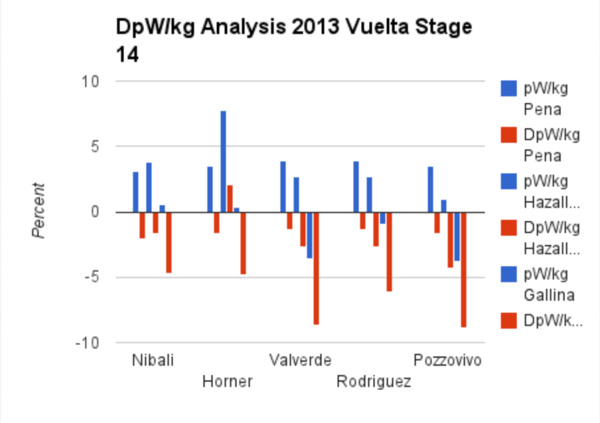
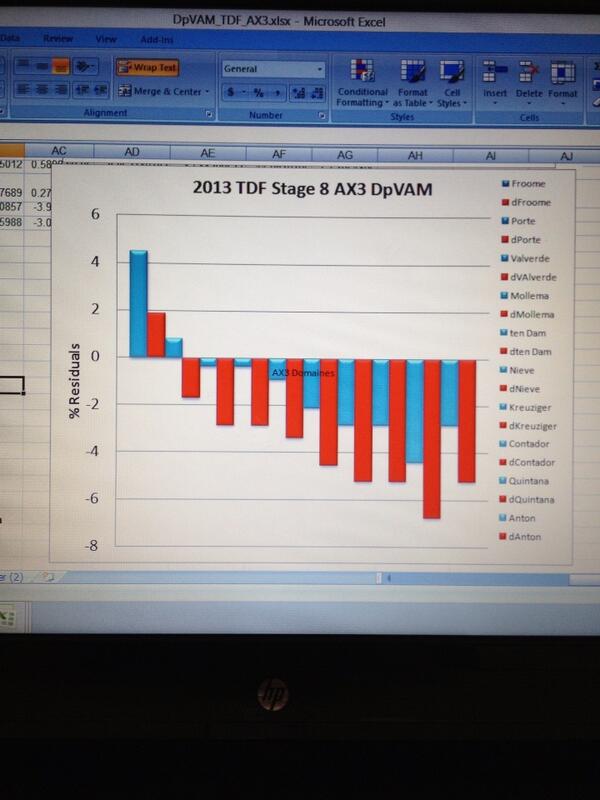
comparing it with the DpW/kg (historical model)
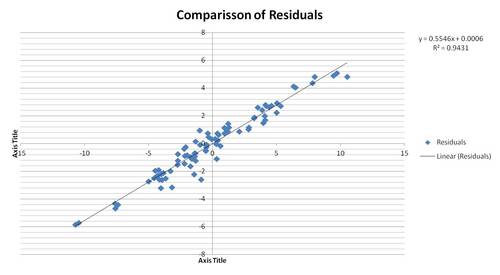
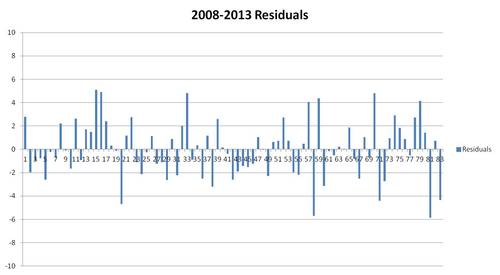
the one thing that jumps out is the magnitude of the residuals
about half of the DpW/kg
(due to the initial transformation)
to bring them equal just divide the pVGRAD output by 0.55
after having checked for biases
plotting DpW/kg and pVGRAD residuals against
Time, VAM, V, Altitdude, vCiimb, Distance etc
its clear that their is small variations between the two
but nothing skewing either data set
so over the course of several observations
they will both regress to the same relative mean
* * *
so basically way simpler
with all input directly measurable
* * *
veloclinic is the reincarnation of one of our favorite Twitter friends, @captaintbag1, whose tumblr blog posts were a kind of blank verse, Tecate-soaked haiku of truthiness that cut through the slick bullshit and to the very core of what is gloriously fucked up about the sport of cycling. Although the Cap may be gone (sort of), his Doctor tbag/Captain Hyde alter ego lives on, and we’re glad to share his pithy analysis here.
Lest you think these are the idiot ramblings of a madman, we’d like you to know that the doc is a legitimate professional in the science of sports medicine, and a savant when it comes to doping analysis. You have been warned.
Nowadays Doc is much in demand as a legitimate authority-type commentator on the science of cycling performances, and his work has been featured in VeloNews, Outside online, and prominent sports medicine publications and symposia. His tumblr, in its current incarnation, may not be safe for cycling fans.









No Comments