Follow the link
n
scroll way over
to

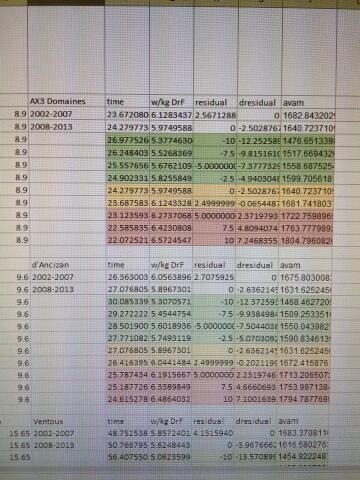
the tables are a quick reference to see
-10% through +10% residuals for each climb
via the Scott Richard’s method
+ faster than predicted, – slower than predicted
in increments uv 2.5%
(note that there are 2 tabs 1 using Vetooo’s data and 1 using Vayer’s as they differ slightly)
remember the residual is how a performance compares to
the 2008-2013 pVAM baseline
which is essentially the average VAM (vertical meters per hour)
adjusted for gradient, altitude, and vertical meters climbed
the Dresidual is how a performance compares to
the 2002-2007 “Doper” baseline
watts/kg are calculated using the Ferrari equation
n the color coding
is the DpVAM index
green (2 bars down) = humanly possible
yellow (split bars) = suspicious
red (2 bars up) = doped
based on the premise that performances slower than the pVAM
ie slower than the 2008-2013 baseline
are arguably possible without doping
while performances faster than the DpVAM
are only possible with doping
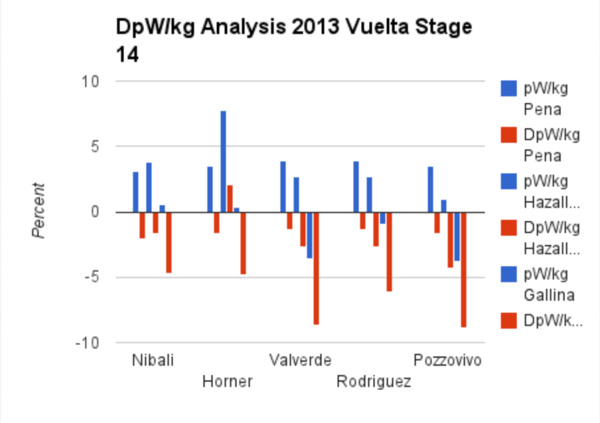
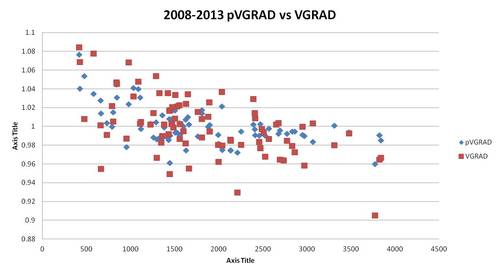
if the overal pattern accros a grand tour is considered
see
vs
as an illustration
note that I can’t garauntee that hesjedal is clean
but he is used as an example
because he is the only Grand Tour winner
with a published biopassport
from his grand tour win
that lacks
significant evidence of doping
as such he’s the only GT winner
worth pointing to as plausibly clean







No Comments