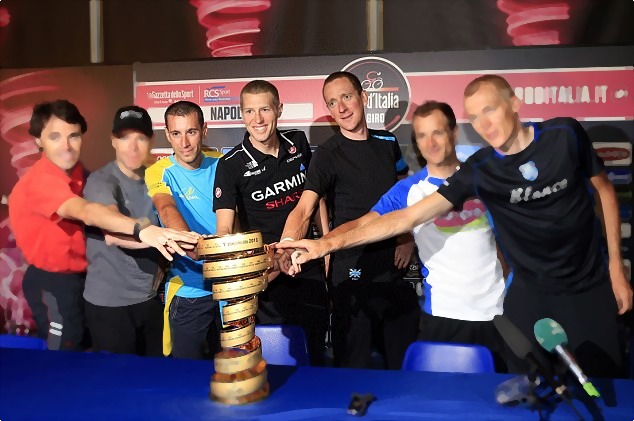
On the eve of what is arguably the strongest field in recent Giro history, I apply the pVAM method to see what science can tell us about the about the contenders. In the first practical test of the pVAM method, I will analyse the recent climbing performances of the three big favourites: Bradley Wiggins, Vincenzo Nibali and Ryder Hesjedal.
While time trialling will shape the outcome of this Giro, it is the climbs where the riders will battle shoulder to shoulder for the right to don pink in Brescia. Of the contenders, it is the trio above who have performed at a Grand Tour winning level in the past 12 months. As such they provide the best benchmark of what to expect from the top climbers in the Giro.
In total, 15 observations from the 12 months since the beginning of the Giro last year were suitable for analysis. This includes Hesjedal’s five performances in the 2012 Giro, eight for Wiggins (Dauphine 2012, Tour 2012, Catalunya 2013 and Trentino 2013) and seven for Nibali (Tour 2012, Tirreno-Adriatico 2013 and Trentino 2013). Wiggins and Nibali climbed together six times: four times they finished with the same time, once they were separated by five seconds (I have used the average) and for the most recent observation in Trentino I have used Nibali’s time only due to the mechanical problems suffered by Wiggins.
The OLS estimation of these performances is surprisingly consistent.[ref]
1 I was prepared for the model to be ineffective with this data given that we are treating three different riders as the same, comparing their performances at different races, and the data set is relatively small. [/ref]
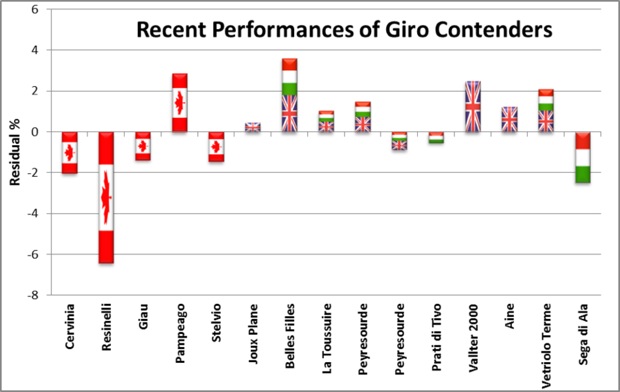
This suggests already that the differences between the three are not great. That is obvious in the case of Wiggins and Nibali, given their head-to-head results, but it shows that Hesjedal’s performances on a completely different race schedule are comparable as well. For a more detailed comparison the percentage residual from each observation are plotted below.
Based on these results, the data suggests that on average, Hesjedal’s performances in the Giro last year were not as strong those from Wiggins and Nibali since then. Taking the differences at face value, it would not seem possible for Hesjedal to succeed against the others on the climbs of this year’s race. However, there are factors from the 2012 Giro which may explain the margin.
Firstly, in most cases a large proportion of the climb was ridden at a reserved tempo. With the race not being “on” from the bottom, it is less likely that the overall climb time will represent the best performance they were capable of on that day. In contrast, most days of climbing for Wiggins/Nibali have seen Sky set a strong tempo from the beginning.
Secondly, there are factors unique to each day which may be the reason for difference. On the Cervinia and Pian dei Resinelli climbs there was some rain about, and the climbs to Pampeago and the top of Stelvio were at the end of brutal stages. Pampeago, where Hesjedal stamped his authority on the race, is the only performance of Ryder’s which compares favourably to Wiggins and Nibali. There were reports of a tailwind on that day but this may only be a counterweight against the 3500m-plus of categorised climbing before the final climb. Focusing only on this result we would expect Hesjedal to put up a strong fight this month.
Going a step further, the pVAM method can be used to make general predictions of the time it will take to complete the climbs in this year’s race. By applying the model of the three riders to the characteristics of the mountains in the 2013 Giro we can calculate a pVAM, and subsequently, predicted time (pTime).
| Gradient | Vclimb | Altitude | pVAM | pTime | 90% CI | |
| Montasio | 0.0788 | 859 | 1519 | 1643 | 31’23” | 29’43” – 33’14” |
| Jafferau | 0.0902 | 654 | 1908 | 1702 | 23’02” | 21’47” – 24’29” |
| Telegraphe | 0.07156 | 848 | 1566 | 1584 | 32’07” | 30’21” – 34’07” |
| Galibier | 0.06834 | 1237 | 2642 | 1395 | 53’13” | 49’32” – 57’29” |
| Val Martello | 0.06255 | 1398 | 2059 | 1388 | 60’27” | 56’09” – 65’27” |
| Tre Croci | 0.072956 | 580 | 1805 | 1601 | 21’44” | 20’29” – 23’09” |
| Tre Cime | 0.12175 | 460 | 2304 | 1854 | 14’53” | 13’50” – 16’07” |
The 90% confidence intervals are included in order to provide a range which the actual time should fall into. The range may seem very large, but this ensures that any observation outside the confidence interval is only likely to occur under extraordinary circumstances such as unexpected tactics or extreme weather. As Telegraphe-Galibier and Tre Croci-Tre Cime are closely connected climbs on the same stages, it is like that there will be a trade-off with a higher performance on the first mountain resulting in a lower performance on the second. For the remaining three climbs, under normal conditions the expected actual observations to fall within a few percent either side of the prediction.
For a rider outside of these three favourites to win the race overall, they would have to climb (on average), faster than the predicted times. Over the course of the three weeks, the analysis will be updated with actual observations for a real time look at how the race is unfolding.
Thanks to Veloclinic for help with this piece.







1 Comment
“Taking the differences at face value, it would not seem possible for
Hesjedal to succeed against the others on the climbs of this year’s race”
Given what’s happened thus far, your predictive methods seem pretty on point. Fun article, insightful stuff particularly for those data nerds among us.
Would you by chance be willing to share your OLS model?
Cheers,
James